. . . - . . .  . . .
. . .
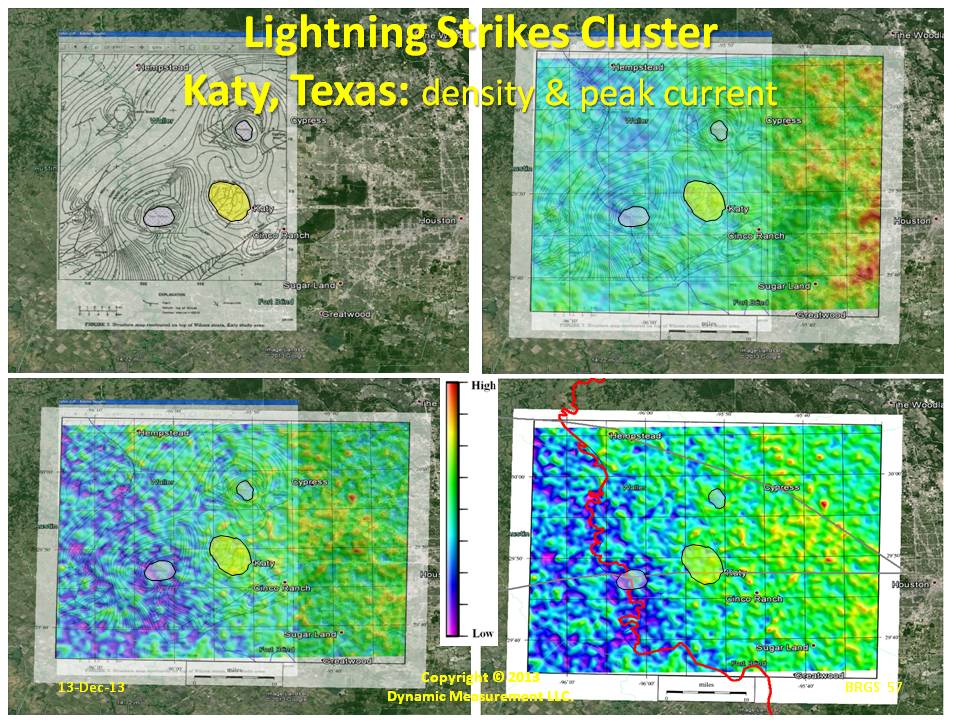
These four maps are over the Hockley and Brookshire or Sealy salt domes and the Katy intermodal structure. The upper left map is a legacy map of Top Wilcox.
The upper right map shows lightning strike density semi-transparent over the structure map. There is higher density as you approach Houston, which is partly due
to the city and infrastructure and partly due to a general increase in density to the east. There are patterns around the domes, and obvious clustering of strikes.
The bottom two maps show peak current across the same area. The left image is semi-transparent and the right image is solid. Note the differences separated by the Brazos.
I think the Brazos River is related to a remnant Cretaceous transverse fault. We need to do additional analysis to look at things like soils databases. The differences are obvious.