. . . - . . .  . . .
. . .
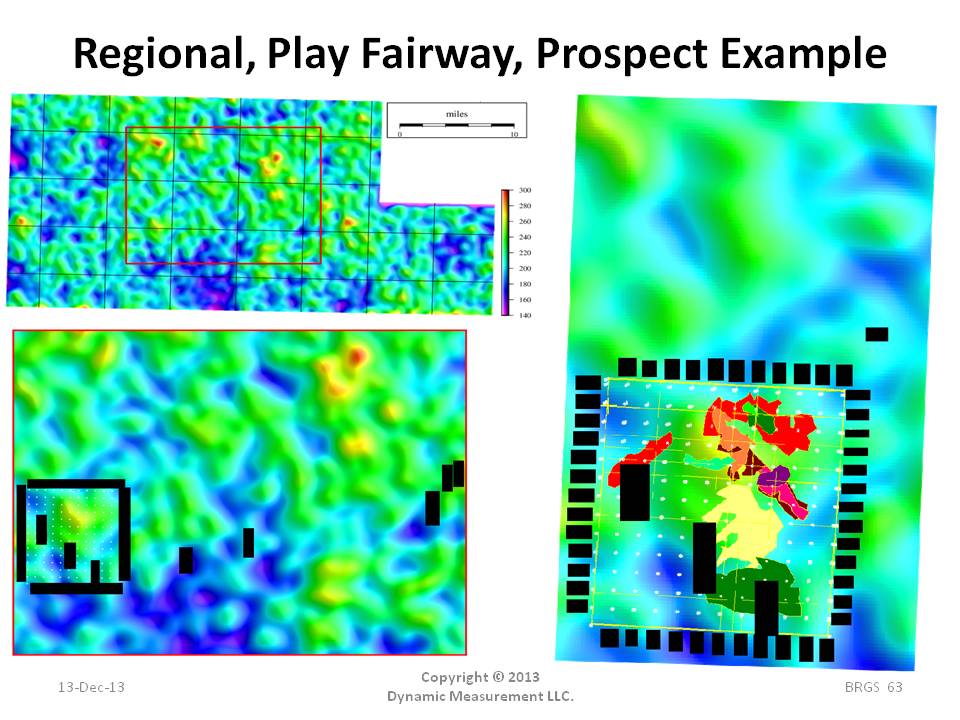
This example is the same as the previous slide, only the prospect outlines have been colored. Note how the red Prospect aligns with the blue lineament.
Also note how the majority of the anomalies are along the axis and top of the lightning anomaly, which was where the bright spots and possible seeps are located.