. . . - . . .  . . .
. . .
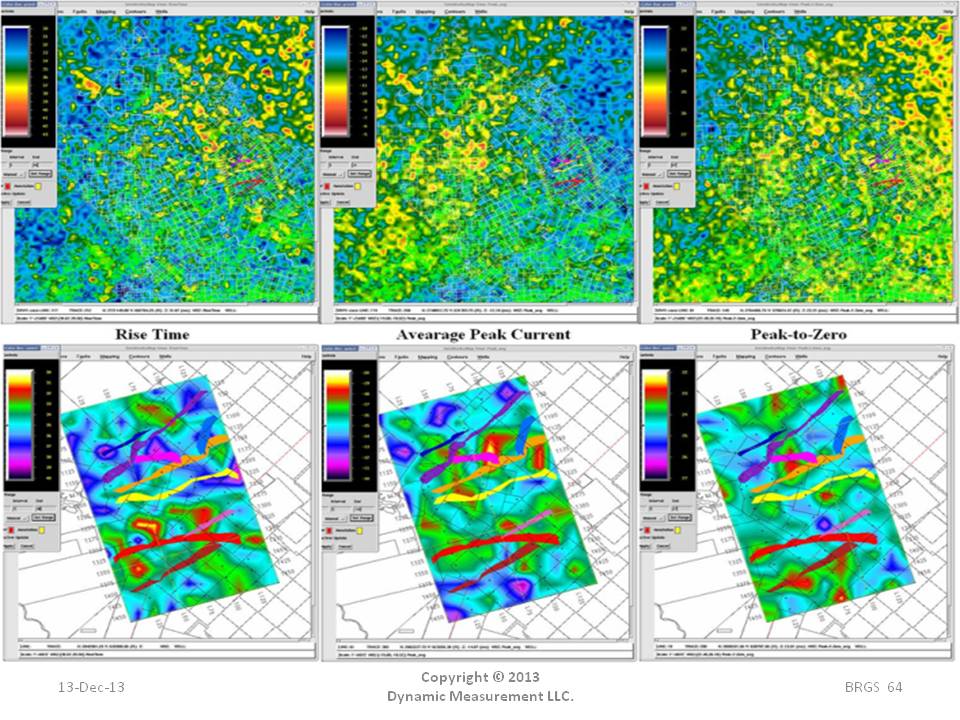
This example shows three maps of different lightning attributes from southern Colorado County, Texas. There are "regional" maps and close-up maps tied to the
extent of a small 3-D seismic survey. The maps show the distribution of Rise-Tie (microseconds), Average Peak Current (kiloamps), and Peak-to-Zero (microseconds).
The first thing to notice is how different the three lightning strike attributes look. They are from the same data and the same storms, and yet the maps look very
different from each other both at the "regional" and at the "3-D" scale. What is consistent is how the 3-D seismic faults separate unique values for each attribute.